Definitions
Coordinate System
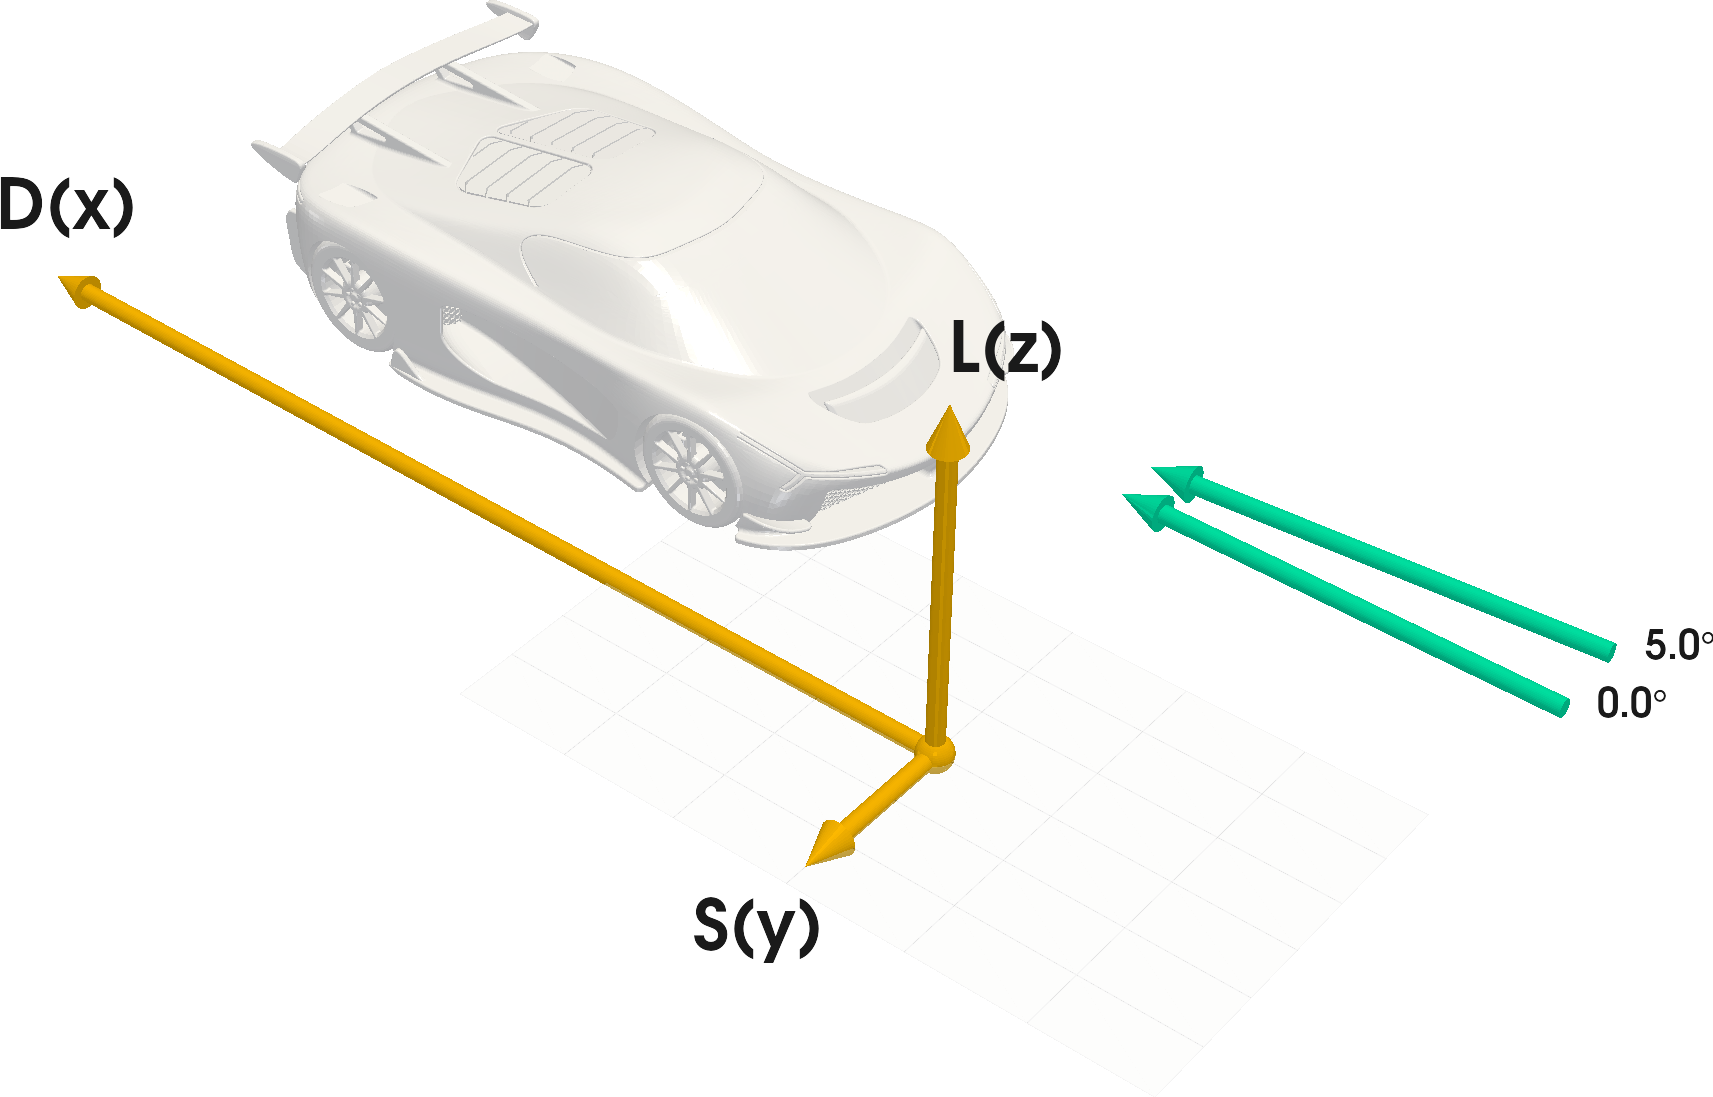
Forces and moments are defined according to a right hand coordinate system.
- Positive drag force is along the X-axis
- Positive side force is along the Y-axis
- Positive lift force is along the Z-axis
Moments are calculated about the model origin where:
- Rolling moment is about the X-axis
- Pitching moment is about the Y-axis
- Yawing moment about the Z-axis.
The yaw angle is defined as the angle between the wind vector and the model x-axis and is positive counter-clockwise.
Your requested yaw angles are also indicated in the model preview window when setting up your model.
Pressure
The surface pressure shows the force per area, normal to the surface of the body. The surface pressure decomposed along the three coordinate axes and integrated around the surface, gives drag, lift and side pressure force.
The total pressure field shows the energy in the flow around an object. The total pressure is defined as the sum of the static pressure and the dynamic pressure.
When the boundary layer separates from an object, a low pressure, turbulent wake will form behind the object, and the resulting pressure difference around the object causes pressure drag.
Skin friction
In viscous fluid flows a frictional force will be excerted by the fluid on the surface of immersed objects. This is called skin friction.
The frictional force is caused by a viscous stress component (shear) that exerts a force parallel to the local flow direction due to a normal velocity gradient. The shear stress on a solid boundary is called wall shear stress, and can be interpreted as a frictional force which is directed along the local flow direction, tangential to the surface of the body. It is caused by the velocity gradient in the boundary layer and fluid viscosity. The force is directed along the local velocity vector.
Areas of low wall shear stress have a low local flow velocity. Along separation lines the wall shear stress will be zero.
The wall shear stress is normalized by the dynamic free stream pressure to give the non-dimensional friction coefficient:
$$ C_f={{\tau_w}\over{{1\over2}\rho U_{\infty}^2}}$$
Forces and moments
Fluid dynamic forces on an object are the sum of pressure forces and viscous forces.
In general, pressure forces are dominant for high Reynolds number flows around bluff bodies, while viscous forces are dominant for streamlined bodies and low Reynolds numbers.
The directions & sign conventions for the forces & moments are discussed here.
Normalized coefficients
Non-dimensional force and moment coefficients are calculated by normalizing the aerodynamic force and moment components by the freestream dynamic pressure and predefined length scales.
$$C_F=\frac{F}{\frac{1}{2}\rho_{\infty} U_{\infty}^2A}$$
$$C_M=\frac{M}{\frac{1}{2}\rho_{\infty} U_{\infty}^2AL}$$
The reference area $A$ is the projected frontal area of the model and the reference length $L$ is 1 meter.
Non-dimensional static and total pressure coefficients are calculated by normalizing the respective pressures by the freestream dynamic pressure.
$$C_{p_{static}} = \frac{p_{static}}{\frac{1}{2}\rho_{\infty} U_{\infty}^2}$$
$$C_{p_{total}}=\frac{p_{static}+\frac{1}{2}\rho \vert u \vert^2}{\frac{1}{2}\rho_{\infty} U_{\infty}^2} $$
The ISO standard atmosphere (ISO 2533:1975) air density of 1.225 $kg/m^3$ is used for all normalizations for air. A value of 1020 $kg/m^3$ is used for water.
The freestream wind speed ($U_{\infty}$) is used for normalization for all yaw angles, implying that the model-aligned wind will decrease for increasing yaw angle.
Drag Pressure
The drag pressure field visualizes the local drag force on the surface of a body. This variable is a decomposition of the surface forces acting on the object along the drag axis (x-axis). It includes both the pressure and the skin friction contributions.
The drag pressure coeffcient is calculated as:
$$ C_{P_x}={{\tau_{w_x}+p_x} \over {{1\over2}\rho U_{\infty}^2}}$$
where $\tau_{w_x}$ and $p_x$ is wall shear stress and pressure along the x-axis, $\rho$ is fluid density and $U_\infty$ is free stream velocity.
This plot is useful for identifying which regions of the model generate drag (or thrust).
The colormap for drag pressure includes a white midrange around zero, which makes it easy to identify drag regions (positive values), thrust regions (negative values) & regions where drag is negligible (white).
Heat Transfer
The convective heat transfer from model surfaces is estimated from using surface friction and the Reynolds analogy.
This theory describes the similarity between momentum transfer and heat transfer between a surface and a fluid. It provides an approximation of the heat transfer from the velocity field without solving a thermal energy equation.
As it is based on an analogy, the accuracy and applicability of the method varies and these results should only be regarded as a first approximation of heat transfer.
It does however provide a useful way to compare designs where heat transfer from model surfaces is important (for example, cycling helmet ventilation).
The heat transfer coefficient ($h$) is calculated as:
$$ h = \rho U_\infty C_p {C_f\over2}$$
$$ C_f = {\tau_w \over {1\over2}\rho U^2_\infty} $$
where $C_f$ is the friction coefficient, $\tau_w$ is wall shear stress, $U_\infty$ is free stream velocity and $C_p$ is the specific heat capacity at constant pressure.
The physical properties of the fluid are evaluated at standard atmospheric conditions.
Note: The averaged heat transfer coefficient values are based on the wetted surface area of the model or part. If parts or models are intersecting, this area will be smaller than the area of the original model or part.
Acoustic Power
The acoustic power field is calculated using Proudman’s formula, a technique that uses steady-state turbulence data to predict flow-induced noise.
This method is perfectly suited to AeroCloud simulations & produces a good prediction of flow-induced noise, without having to resort to much slower (& more expensive) simulation methods.
It is particularly useful for comparing the relative performance of options in early-stage design studies.
The process first calculates acoustic power $P_A$ in $\text{W}/{\text{m}^3}$
$$ P_A = \alpha_\epsilon \rho \epsilon M^5_t $$
where $k$ & $\epsilon$ are the turbulent kinetic energy & dissipation rate respectively.
$\alpha_\epsilon$ is an empirical constant, equal to $0.1$ and
$$ M_t = {\sqrt{2k} \over a_0}$$
where $a_0$ is the speed of sound in air.
We display the acoustic power in decibels, using the following conversion:
$$ L_P = 10 \log {P_A \over P_{ref}} $$
where the reference power, $P_{ref}$, is constant at $1e^{-12}$ $\text{W}/{\text{m}^3}$.
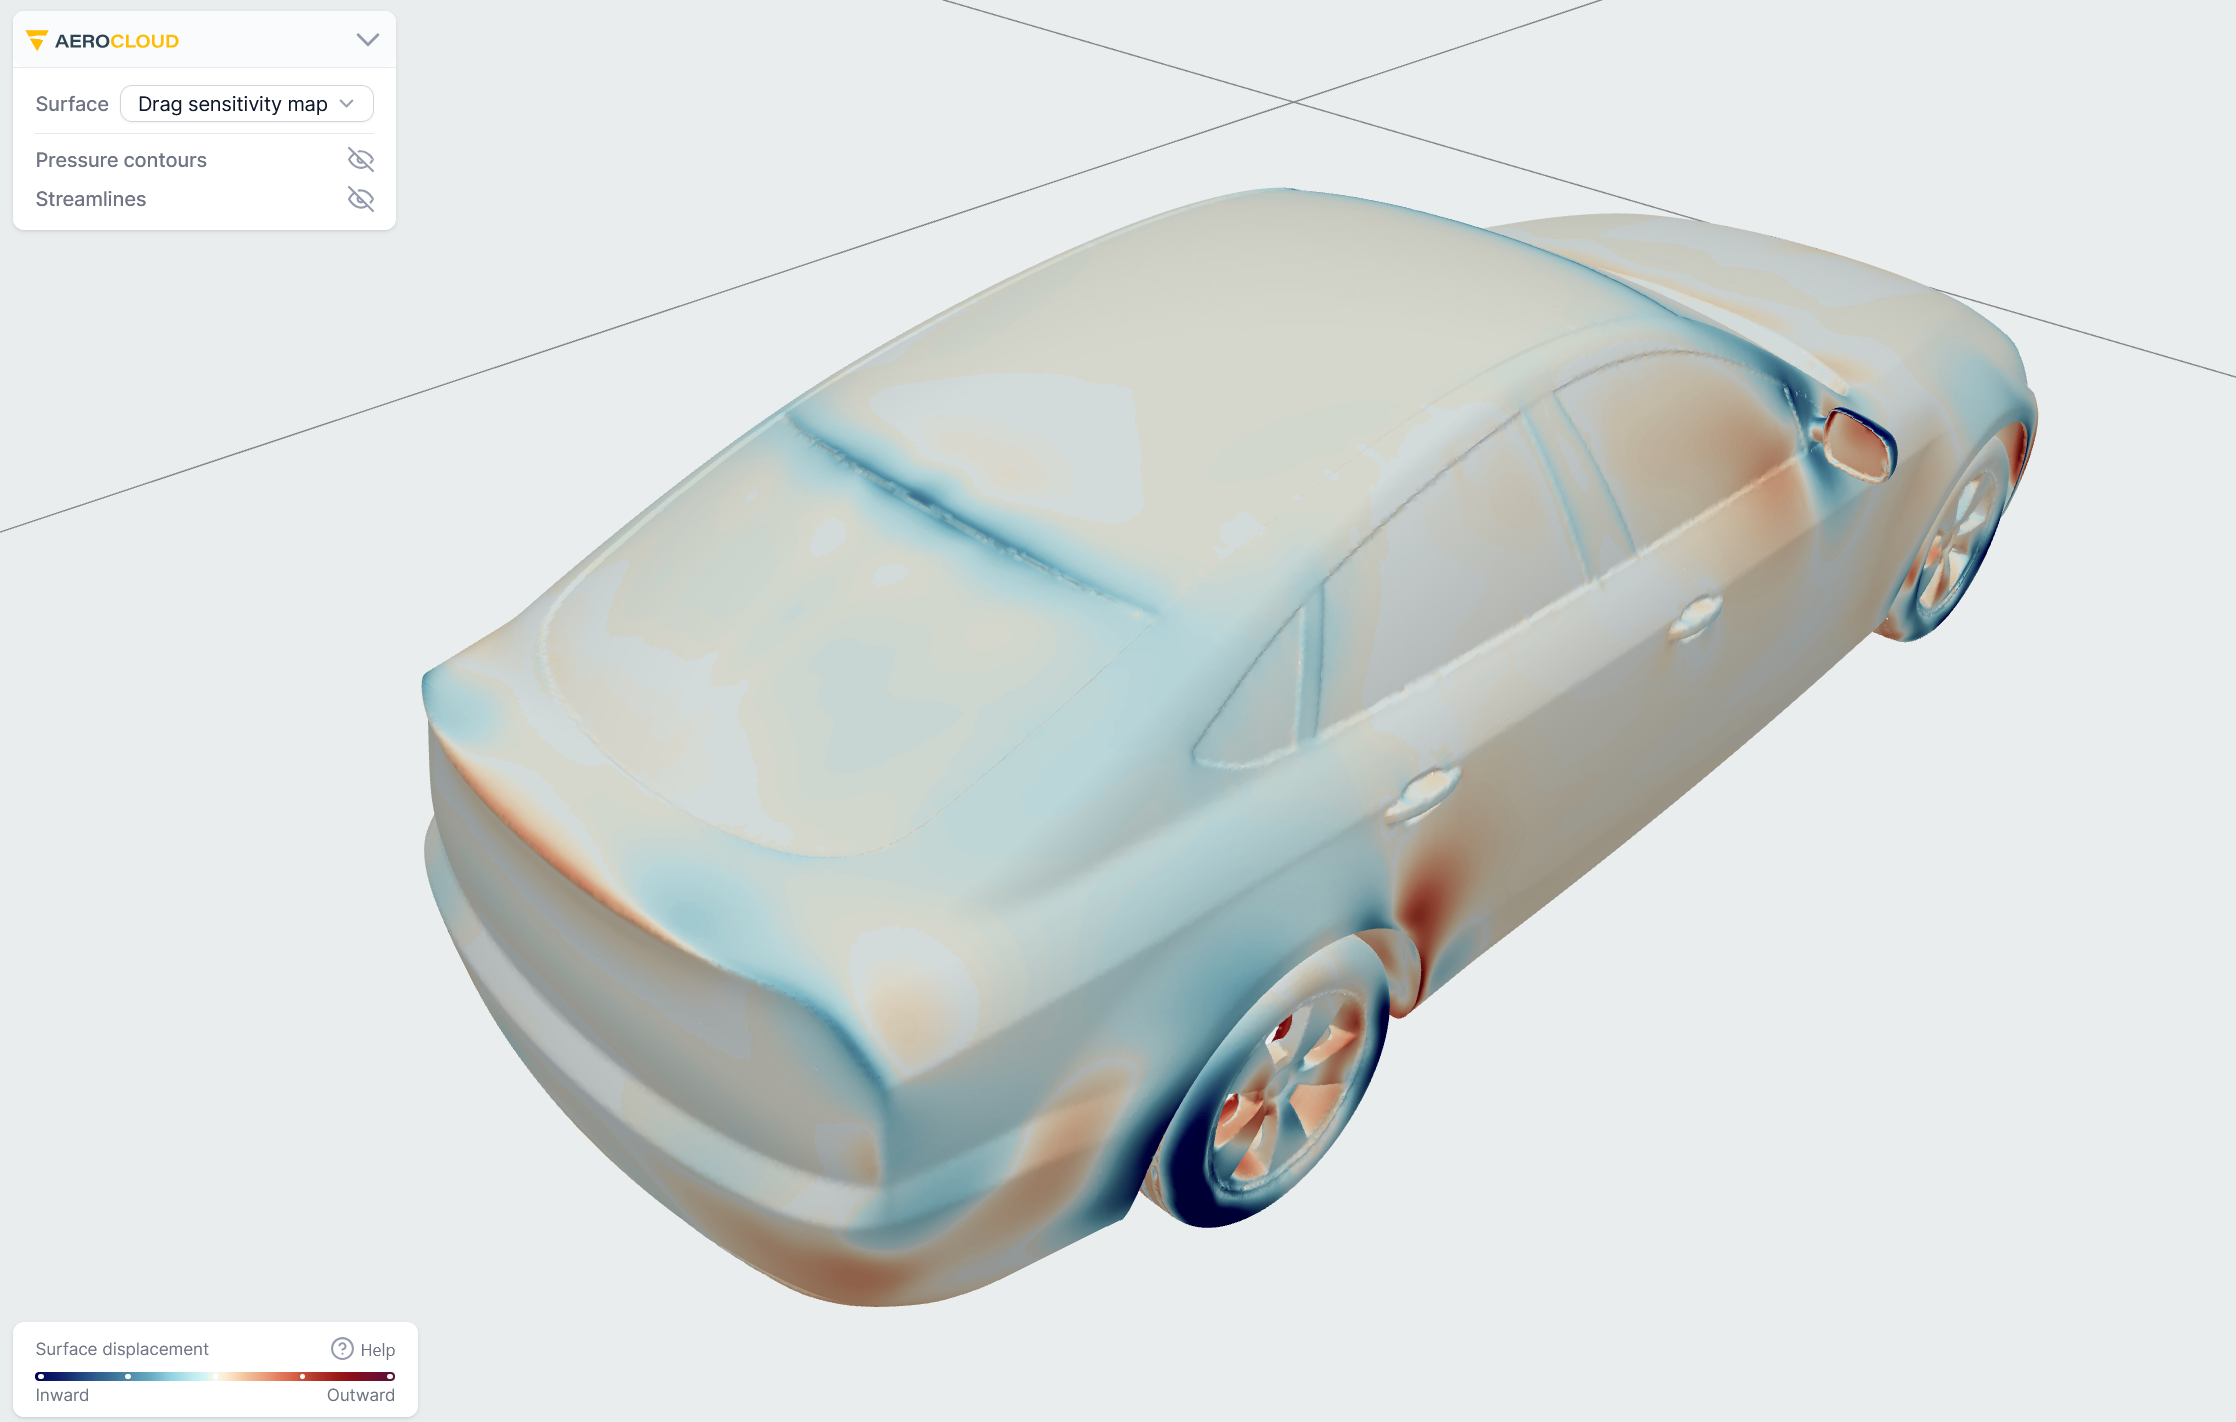
Sensitivity maps (BETA preview)
Sensitivity maps are showing how sensitive a given global variable (e.g. drag force) is to local modifications of the surface topology. They can be readily used in a design optimization process to identify regions of the model that are suitable for design modifications.
The sensitivity maps are derived from the initial simulation solution, solving an additional set of equations called adjoint equations. The solution predicts how the objective variable (drag force) will change with respect to changes in the input (model geometry). The resulting sensitivity map is presented as a surface field on the model with a scale indicating if a positive or negative displacement of the surface would improve the design.
Sensitivity maps post-processing
The AeroDesign Assistant could be used in an optimization loop, in order to create a geometry with improved aerodynamic properties. This can be achieved through an iterative process where the original geometry is adjusted based on the sensitivity field produced by the AeroDesign Assistant. The following process is repeated until an improvement in the objective function is obtained:
Normalize the sensitivity field values optined from the AeroDesign Assistant. The most sensitive points are assigned a value of +-1 depending depending on the direction of the displacement.
Set a maximum absolute displacement for each component to be affected by the morphing process.
Optional: Apply a smooting function to the displacement value. This is useful to avoid self-intersection for geometries with sharp corners and edges. In these cases it is advisable to increase the amount of smoothing or reduce the maximum displacement, or make manual adjustments in problematic regions.
Produce a new geometry by applying the displacement field to the input geometry and constraining the interface points between parts on order to avoid openings.
Optional: smooth the new geoemtry (e.g. laplacian smoothing) keeping same constraints of point 4
Rerun the simulation with the AeroDesign assistant to produce a new sensitivity map.
It is not guaranteed that one will see an improvement in the global objective function after the few first iterations of an optimization cycle. The changes of the shape resulting from each iteration will indicate how the geometry impacts on the flow around the morphed component itself and on the interaction with surrouding components. This brings insights on how to proceed with the design in order to better control the fluid flow.
The AeroDesign Assistant do not take into account structural or manufacturing constraints. For this reason manual adjustments of the resulting geometry will be required to fulfill such constraints.