Interpretation & Solutions
Once the CFD simulation is complete, the focus shifts to the analysis of Pedestrian Wind Comfort (PWC) and safety. Follow these structured steps to evaluate the results and identify areas for improvement.
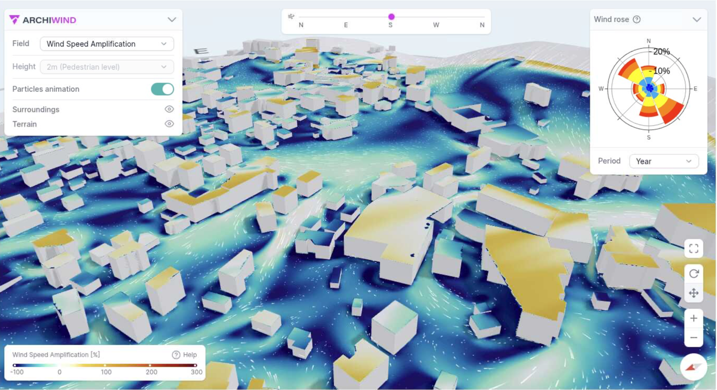
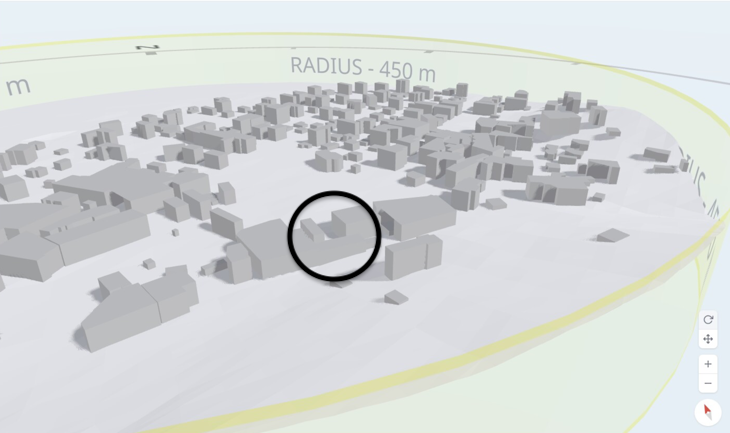
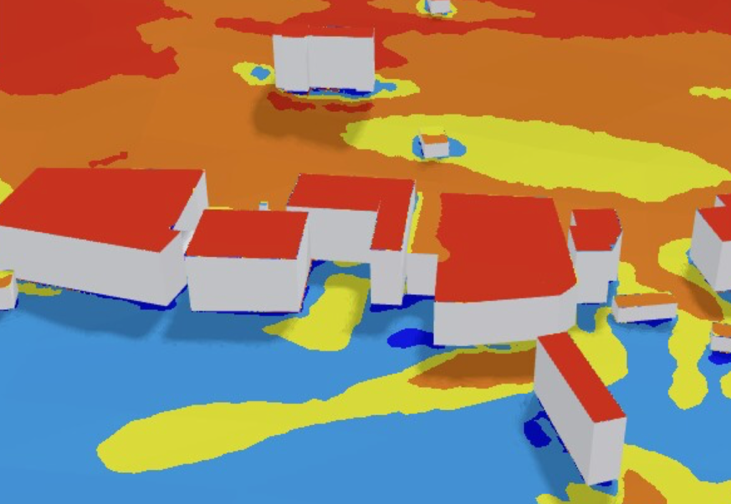
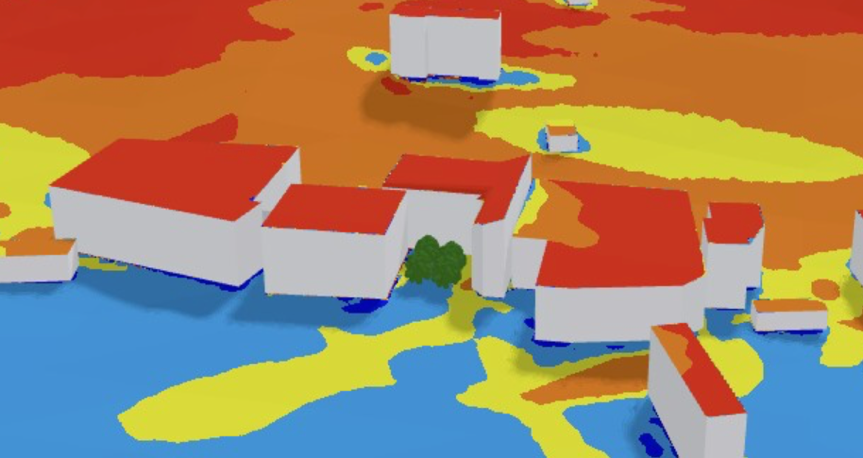
Step 1: identify problematic areas (pwc map)
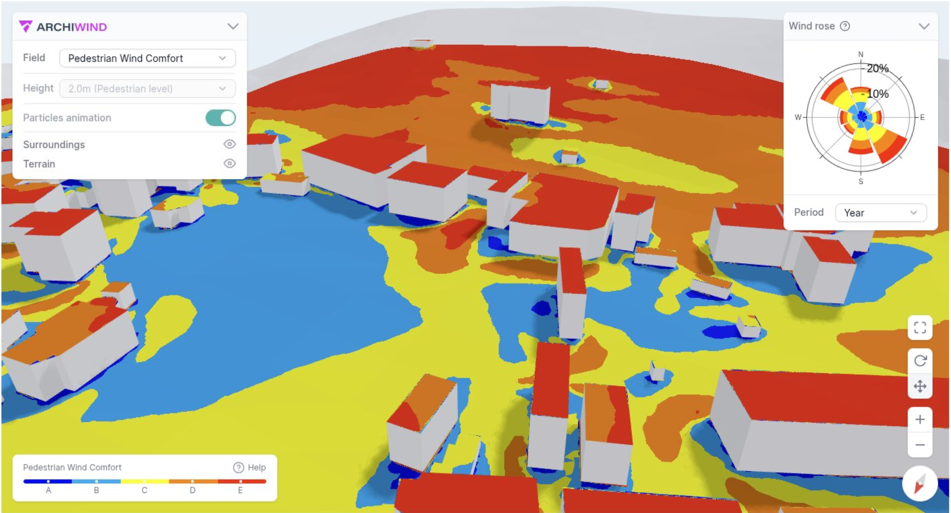
Review the Pedestrian Wind Comfort (PWC) map. Look for orange and red areas where conditions fall below acceptable thresholds. In some cases, yellow areas may also require attention.
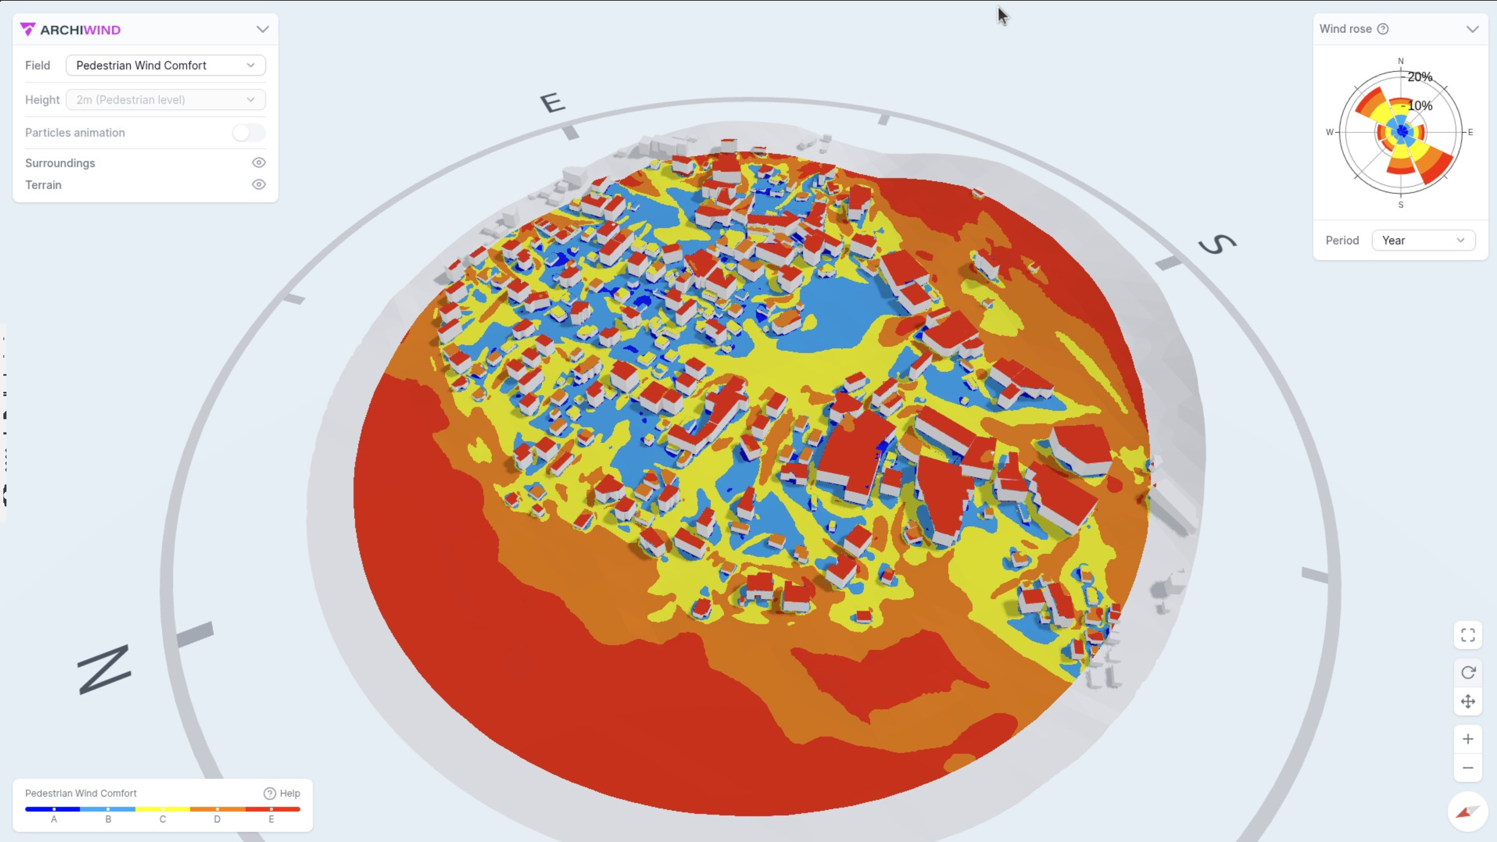
Step 2: determining critical wind directions
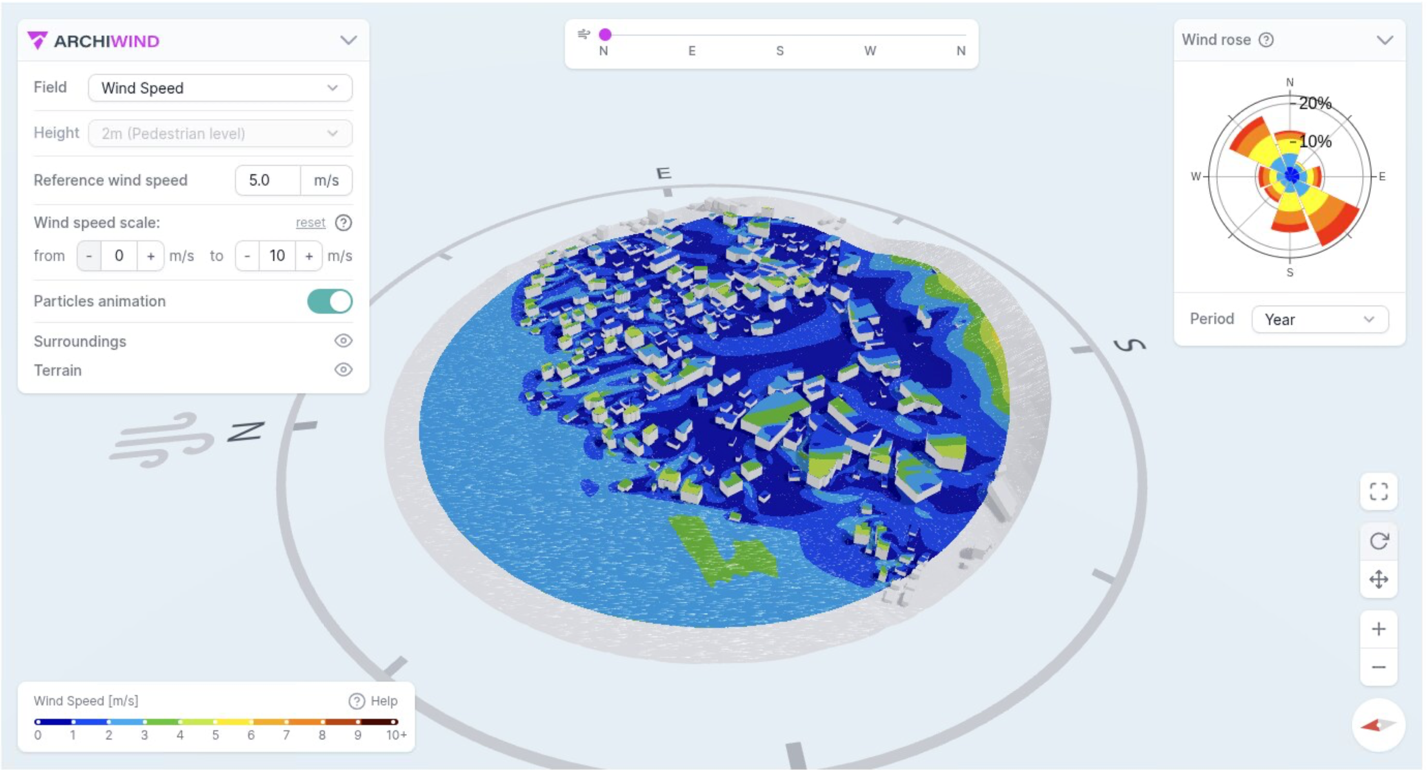
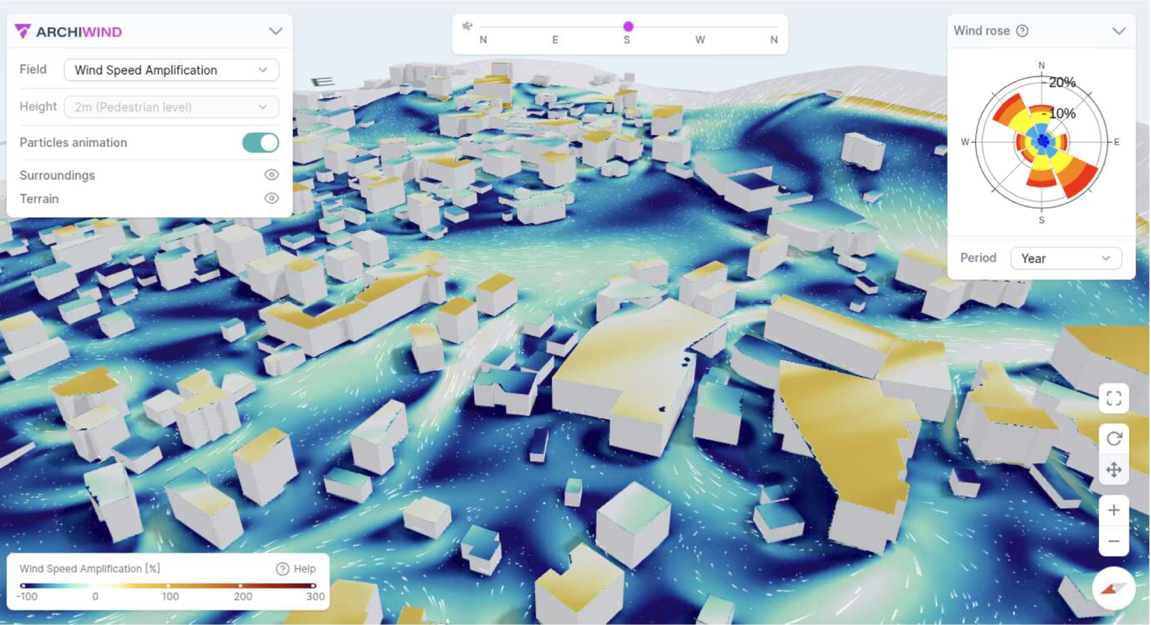
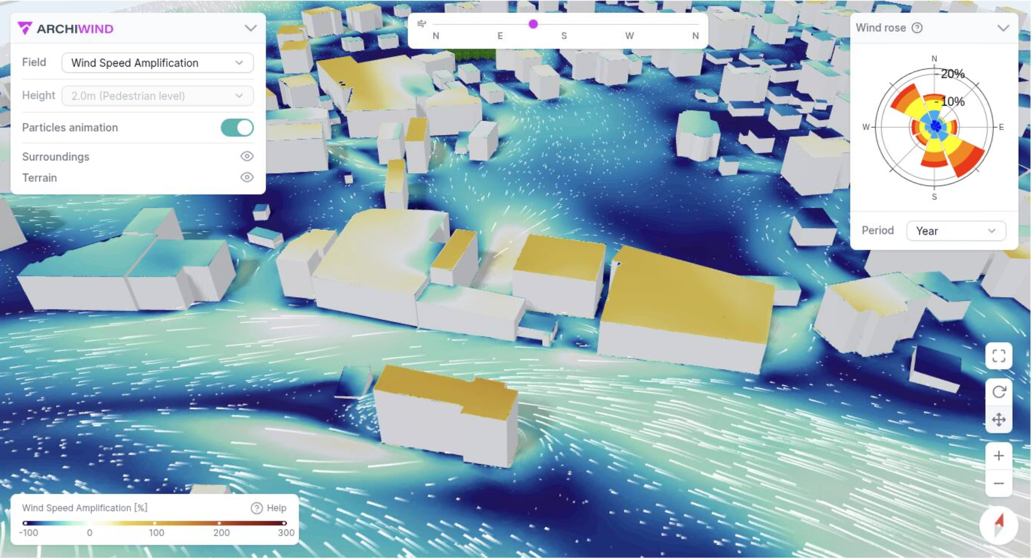
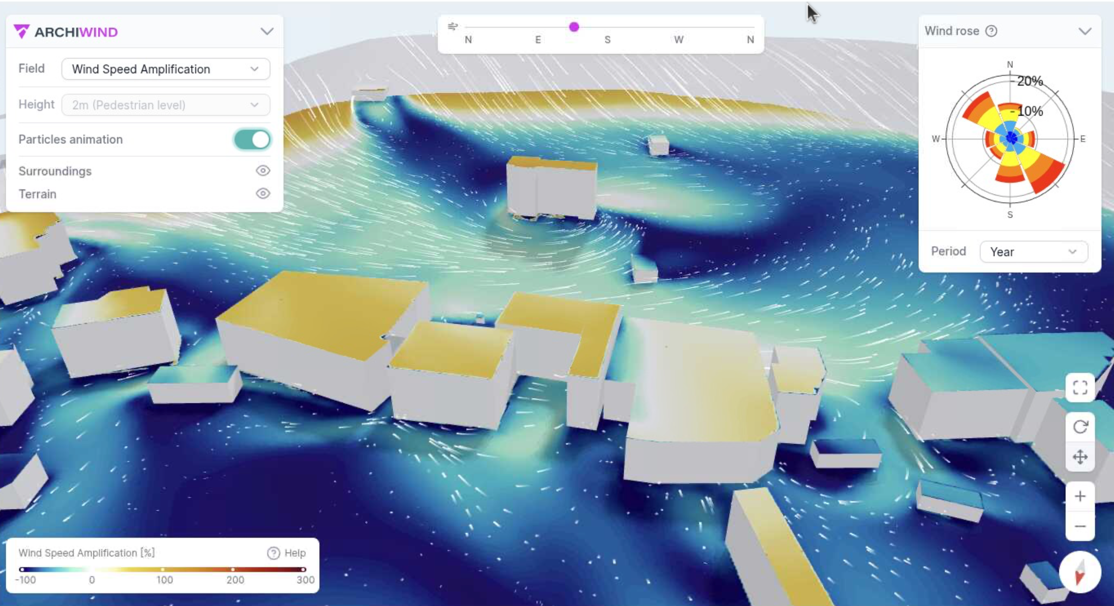
The first thing you can do is to take a look at the wind rose diagram in the upper right corner of the viewer. Each segment of the circle represents a wind sector. The number of sectors is the same as the number of wind directions simulated. Colors within these sectors indicate different speed ranges. The bigger the radius of each sector, the higher the frequency of the wind in that direction
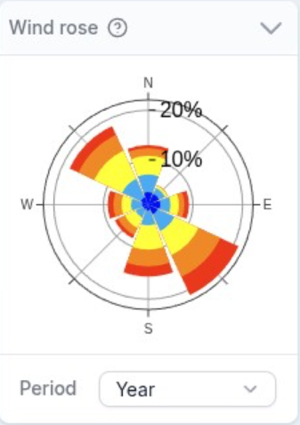
| Color | Wind Speed Threshold (m/s) |
|---|---|
| Light Blue | 0-2.5 |
| Blue | 2.5-4 |
| Yellow | 4-6 |
| Orange | 6-8 |
| Red | >8 |
- Dominant directions: Winds most frequently affecting the site. Ensure these are mitigated.
- High-velocity distribution: Clusters of orange/red indicate directions producing strong local flows.
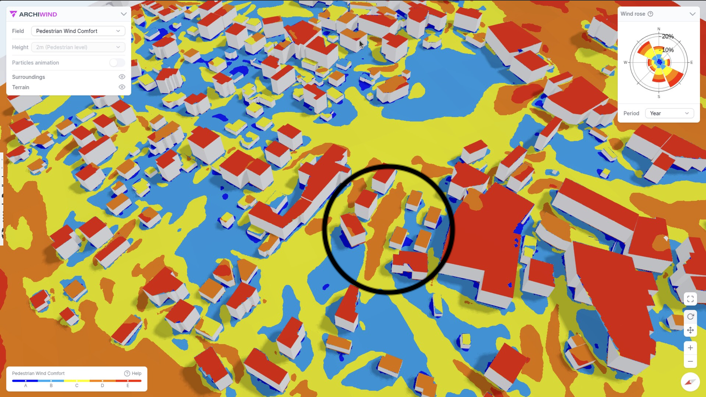
Let’s study these two hotspots below in detail:
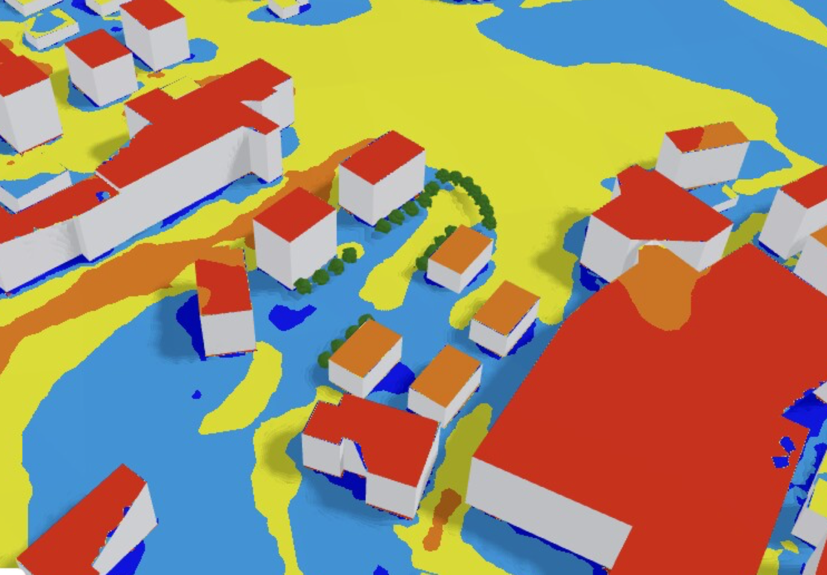
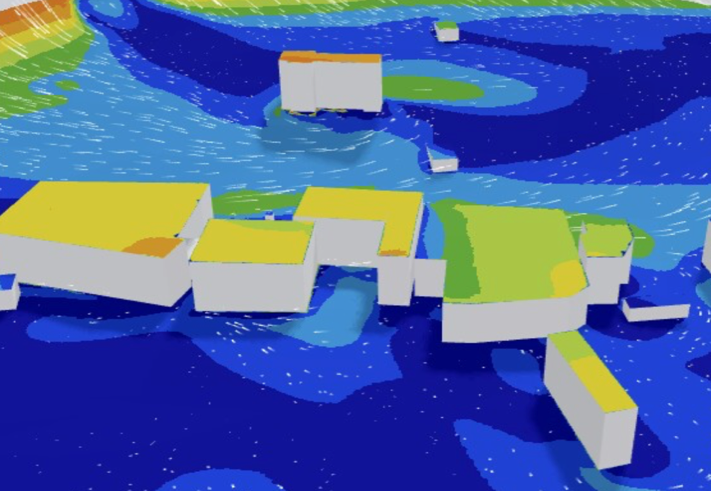
Step 3: visualize wind speed field
Once the hotspots have been identified, the next step is to determine the wind direction responsible for these critical conditions:
Field Selection: From the dropdown menu in the upper-left corner of the viewer, select Wind Speed as the active field
Particle Animation: Activate particle animations to observe how the wind interacts with buildings and topographical features.
Directional Sweep: Use the slider at the top of the viewer to cycle through all wind directions and analyze their specific impact.
Do not rely solely on the wind rose for your analysis; specific building layouts or terrain can enhance wind speeds even from non-dominant directions. Ensure you review every direction by moving the slider through the full range.
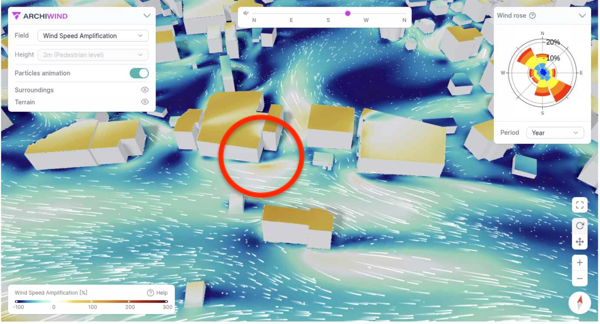
Regarding the first identified hotspot, the highest wind speeds are consistently associated with a Southerly wind direction.
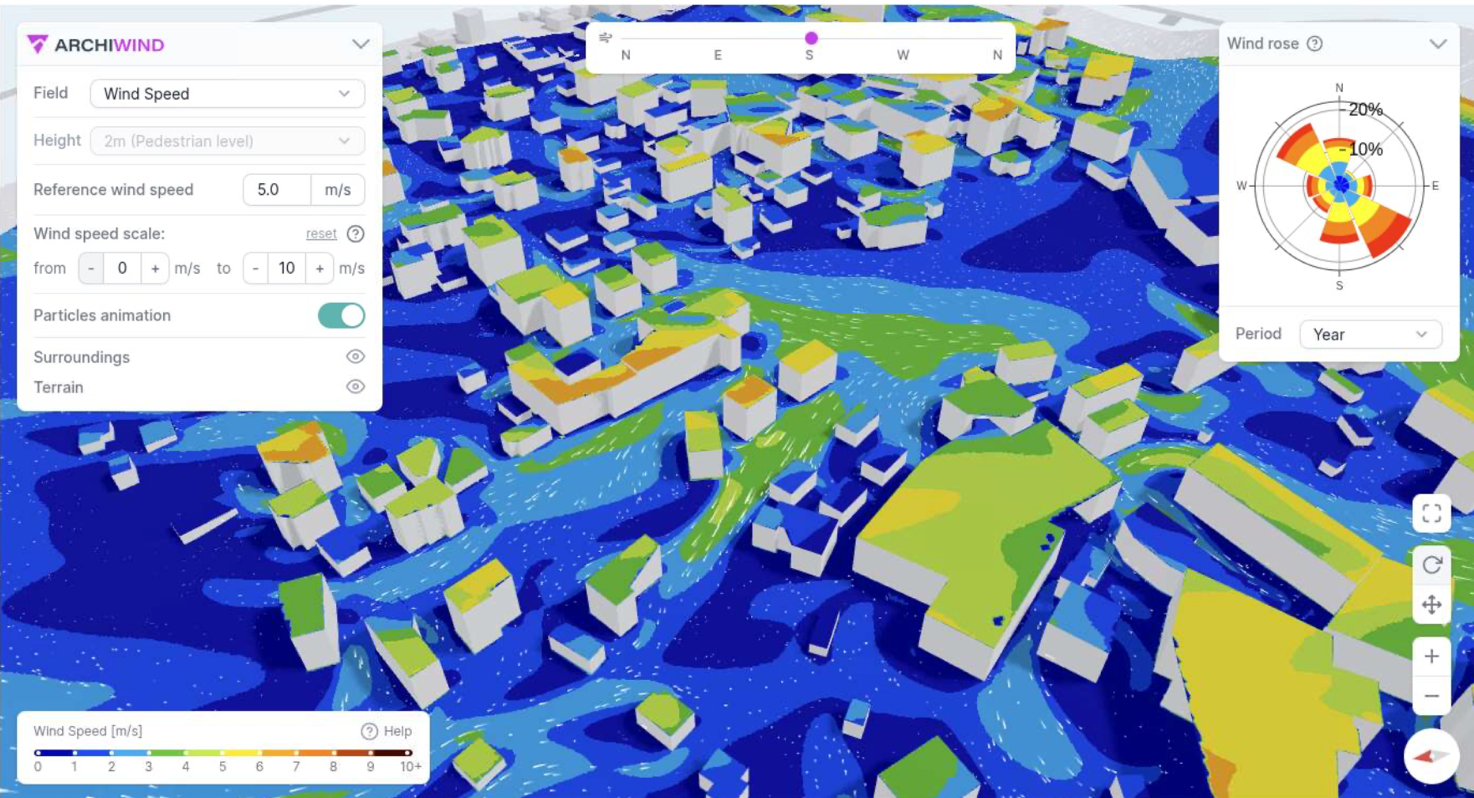
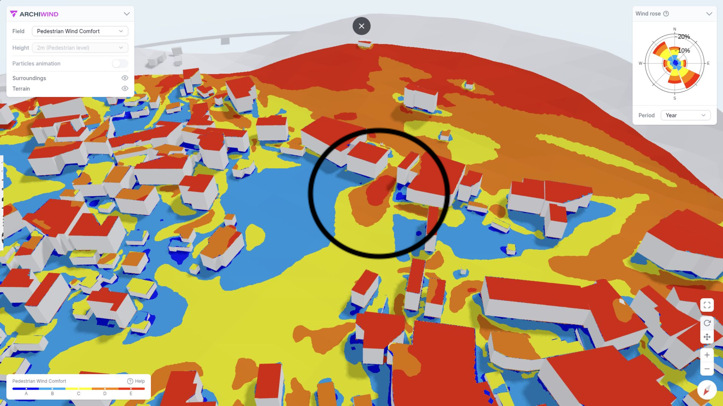
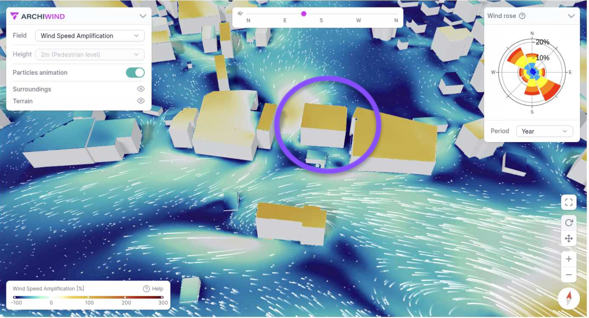
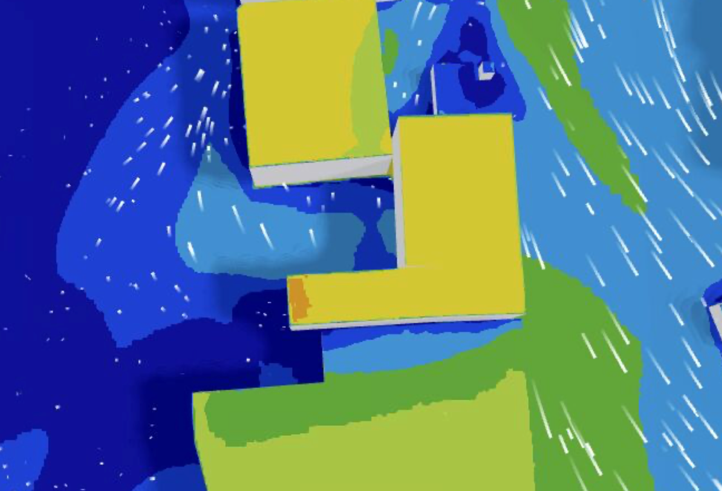
Regarding the second hotspot, the analysis reveals two predominant wind directions associated with high-velocity flows: South-East (SE) and South-West (SW). These directions represent the primary contributors to the localized discomfort in this area.
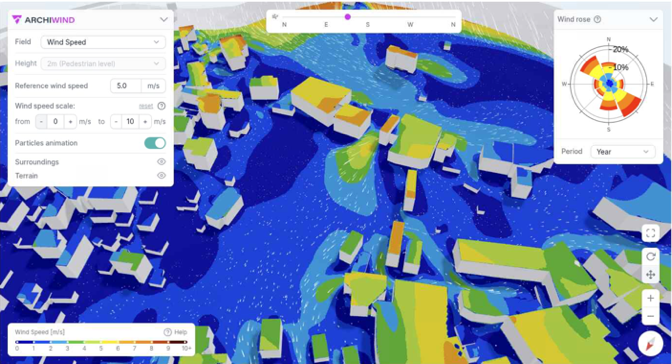
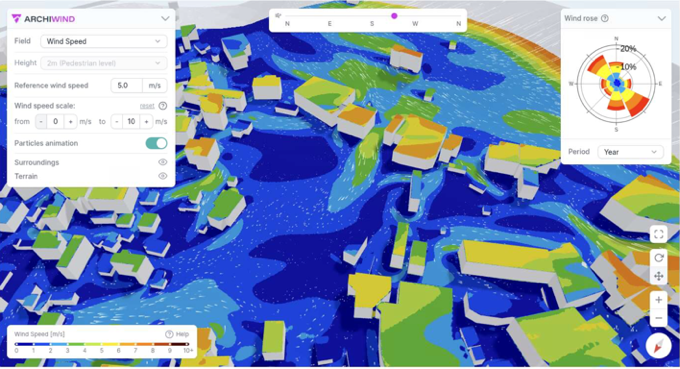
This means that for the next step we will focus on these directions
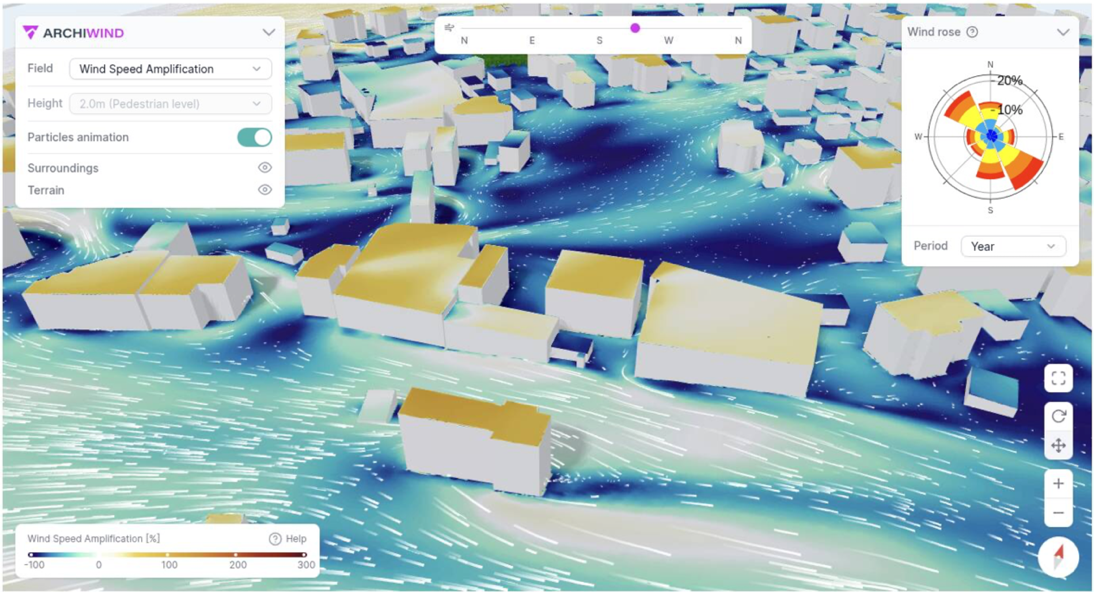
Step 4: visualize wind speed amplification
Having identified the critical wind directions, the next objective is to determine the underlying causes of these hotspots. Switch the active field to Wind Speed Amplification; keeping the Particle Animation enabled will provide a more intuitive visualization of the flow dynamics. The amplification field illustrates how wind speed is modified by specific topographical or structural features.
In the case of the first hotspot, the analysis shows that the wind speed is not being significantly enhanced by the surrounding buildings or topography. The area appears white on the map, which, according to the scale in the lower-left corner, corresponds to 0% amplification. This indicates that the high velocities observed are inherent to the atmospheric wind profile rather than localized aerodynamic effects.
To develop an effective mitigation strategy, you must understand why a hotspot exists. Switch the field to Wind Speed Amplification:
Identifying Causes: This map reveals if high speeds are caused by structural features (e.g., building corners, roofs) or topographical elements.
Quantitative Assessment: White areas indicate 0% amplification, while colored zones indicate the percentage of speed increase relative to the atmospheric wind.
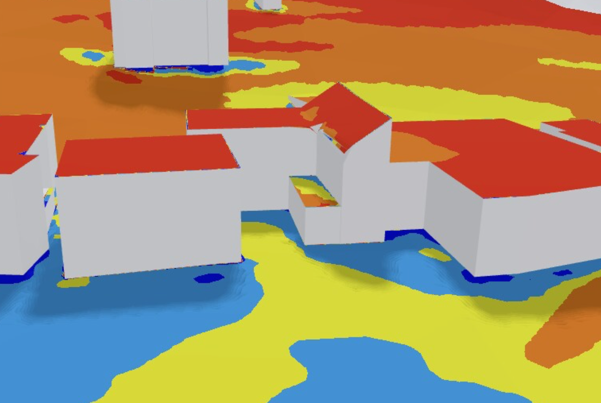
For the second hotspot the situation is different.

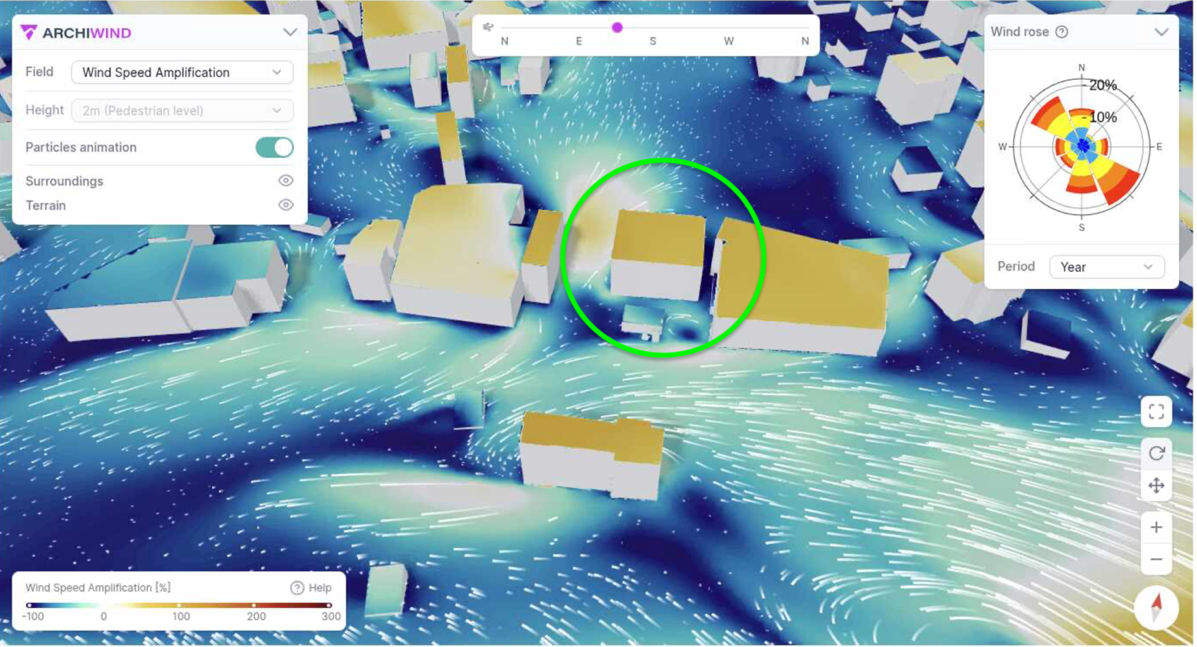
The analysis reveals a wind speed amplification of 100% at this location. This significant increase is attributed to two distinct aerodynamic phenomena: the Corner Effect generated by the building highlighted in red during SW winds, and the flow acceleration over the roofline of the adjacent building (highlighted in green) during SE winds.
To proceed with the solution of our problem we have first to understand the buildings effect on wind
Mitigation solutions
Building effects on wind
There are three main phenomena to be aware of that can lead to wind discomfort:
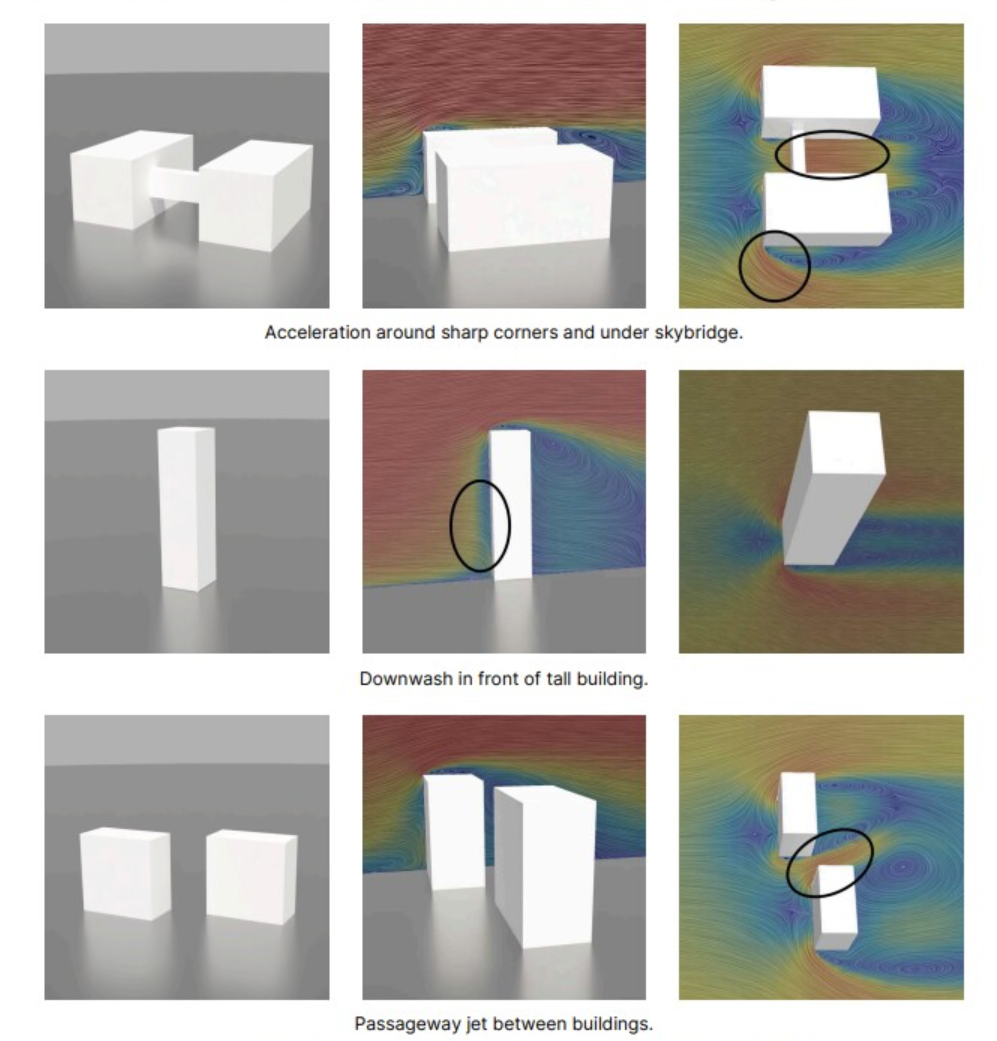
Understanding how buildings alter wind flow is essential for effective design:
Corner Effect: Wind accelerates as it is pushed around the corners of a building facade.
Downwash Effect: High-pressure wind hits a facade (especially on tall buildings) and is forced downward toward the pedestrian level.
Venturi Effect: Wind accelerates when forced through narrow passages between closely grouped buildings.
It is important to note that these phenomena will only sometimes lead to problems. The local wind conditions result from a complex interaction between the size and shape of the buildings, surrounding development, topography, and overall wind conditions.
Case study analysis: identifying aerodynamic patterns in Pettenasco
To effectively address the issues identified in the simulation, we must analyze the specific flow patterns associated with the two main hotspots. Below is a detailed assessment of the aerodynamic phenomena observed at these locations.
Hotspot 1: analyzing the local environment
As previously noted, Hotspot 1 does not exhibit significant wind speed amplification.
Observation: The area remains white on the amplification map, indicating a 0% increase over the ambient wind speed.
Pattern Recognition: The lack of structural interference suggests that this hotspot is caused by the site’s natural exposure to dominant wind directions.
Aerodynamic Insight: Since there are no buildings accelerating the flow here, the high wind speed is purely atmospheric. However, a localized Venturi effect is still present due to the narrowing between the site’s boundaries, which maintains the wind’s intensity. Mitigation should focus on surface-level barriers, such as vegetation or fences, to filter the incoming flow.
Hotspot 2: identifying complex interactions
Unlike the first case, Hotspot 2 displays clear evidence of significant structural wind enhancement, with a recorded 100% amplification in velocity.
SW Direction (Corner Effect): The high speeds are triggered by a Corner Effect from the red building. The wind is forced to accelerate as it navigates the sharp vertical edge of the facade, creating a high-velocity stream at the pedestrian level.
SE Direction (Downwash & Roof Effect): The analysis shows that the wind slides over the rooftops of the purple building and subsequently impacts the opposite wall. This impact triggers a Downwash effect, forcing the air mass downward and significantly increasing the pressure and speed in the street below.
Combined Venturi Effect: In both directions, a strong Venturi effect is recognized. The narrow passage between the red and purple buildings acts as a structural bottleneck, compressing the streamlines and further accelerating the wind as it passes through the gap.
General wind comfort mitigation strategies
At the end of your report, you can always find some suggestions for mitigation strategies you can adopt.
To mitigate these issues, the following strategies were tested:
Strategy 1: vegetation as a porous medium (hotspot 1)
For the first hotspot, which is located in an area with high pedestrian traffic, a structural intervention was not feasible. Instead, a nature-based mitigation strategy was implemented to reduce wind speeds while maintaining the architectural quality of the open space.
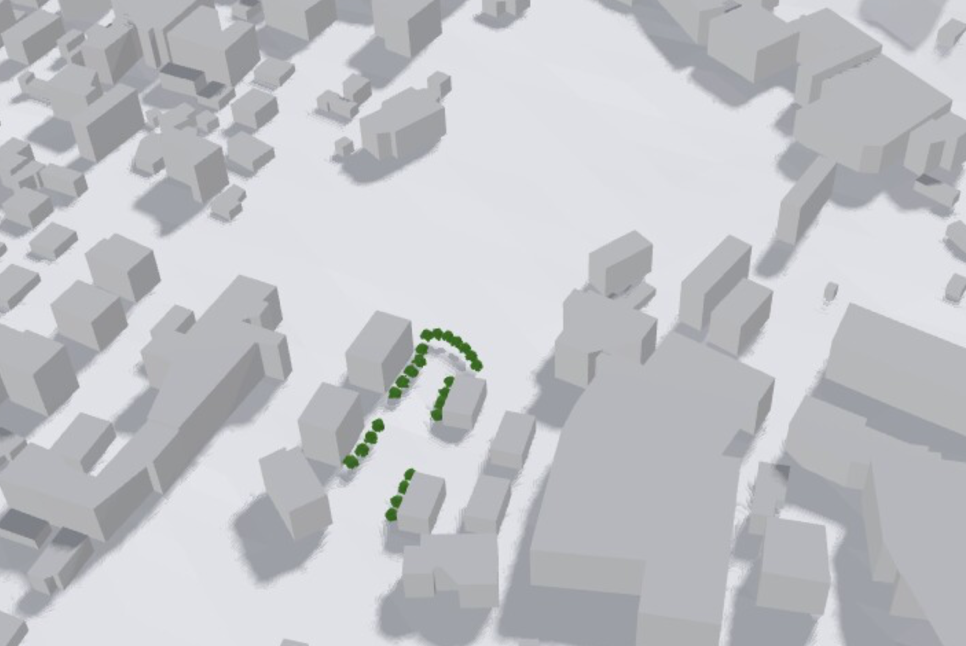
Proposed Solution: Integration of a green belt consisting of trees and hedges.
Technical Objective: In the CFD simulation, vegetation is modeled as a porous medium. Unlike a solid wall, which might simply deflect the wind or create new turbulence, porous media absorb the wind’s kinetic energy. This allows the air to pass through at a significantly reduced velocity, effectively breaking up the Venturi streams identified during the analysis phase.
Strategy 2: structural intervention (hotspot 2)
For the second identified area of concern, the most effective mitigation approach was a direct structural modification. Since this specific zone is not designated for pedestrian use, adding a new volume was a viable and efficient solution.
Proposed Solution: Integration of a new building volume to obstruct the flow path.
Technical Objective: The new structure is designed to act as a physical barrier, effectively “closing” the open corridor. This disrupts the Venturi effect by removing the narrow passage that previously forced the wind to accelerate.
Validation and final results
Re-running the simulation
After implementing the proposed mitigation strategies, it is necessary to validate their effectiveness. To do this, initiate a new simulation using the same environmental parameters and wind data as the baseline study, but replace the original geometry with the updated model containing your strategies.
Analyzing the results
Once the simulation is complete, compare the new Pedestrian Wind Comfort (PWC) map with the initial results. If the strategies are effective, the previous hotspots should show a significant reduction in wind velocity and an improvement in the comfort rating.
Analysis of the first hotspot: evaluating vegetation effectiveness
In the Pettenasco case, the results for Hotspot 1 (where the vegetation was introduced) are highly positive:
Effectiveness: The introduction of trees as a porous medium successfully absorbed the wind’s kinetic energy.
Observation: The PWC map now shows a transition from yellow zones to light blue and blue areas, indicating that the area is now suitable for pedestrian activities.
Conclusion: The vegetation strategy provided the necessary friction to decelerate the flow without creating the secondary turbulence often associated with solid structural barriers.
Analysis of the second hotspot: evaluating structural effectiveness
The outcome for the second hotspot reveals a more complex scenario. While the implementation of the new building volume provided some improvement, the area still exhibits critical wind conditions.
Observation: The PWC map shows only a marginal reduction in wind speeds, with a persistent “hotspot” remaining in the target zone.
Diagnostic Step: To identify why the structural intervention did not fully resolve the issue, we must re-examine the Wind Speed Amplification field for the updated geometry.
Technical Analysis: Analyzing the amplification map allows us to determine if the new building is inadvertently triggering new aerodynamic phenomena—such as secondary Corner Effects or diverted downwash—or if the original Venturi effect has simply shifted rather than being eliminated.
Objective: This step is crucial to understand the limitations of the current design and to decide whether the building’s geometry needs further refinement or if a different mitigation strategy (such as a canopy or vegetation) should be integrated.
By analyzing the results for the South-West (SW) direction, we can observe a significant improvement in the local microclimate.
Corner Effect Mitigation: The new building volume successfully intercepted the flow that previously accelerated around the sharp vertical edges of the original structure.
Elimination of the Venturi Effect: For the SW wind, the structural barrier has effectively closed the urban canyon, preventing the compression and acceleration of the air mass.
Result: The Wind Speed Amplification map confirms that for this specific direction, the area is now adequately shielded. If the SW wind were the only critical factor, the intervention would have been sufficient to resolve the comfort issues in this zone.
While the intervention was successful for the SW wind, the South-East (SE) direction reveals a different and more problematic behavior. The second amplification map clearly indicates that high-velocity zones persist within the hotspot.
Analysis of the Failure: The persistent amplification is likely due to the insufficient height of the added building. Because the structure is too low, it fails to fully disrupt the flow, allowing the Venturi effect to continue in the upper layers of the urban canyon.
Secondary Aerodynamic Issues: Furthermore, the building’s current geometry is still triggering a Downwash effect. The wind hitting the upper part of the facade is forced downward toward the ground, maintaining high speeds at the pedestrian level despite the presence of the new barrier.
Optimization Goal: To achieve total mitigation, we must refine the structural design. The next step involves modifying the building’s dimensions and shape to better intercept the SE flow and break the downward trajectory of the air mass.
Section 7: final geometry refinement and optimization
Validation of the updated structural design
Following the previous findings, a new simulation was performed with an optimized building geometry. This iteration aimed to address the height and shape limitations that previously allowed the SE wind to bypass the mitigation barrier
Observations: The results show a significant improvement. The increased height and refined profile of the building successfully disrupted the Venturi effect across all critical levels. The urban canyon is now effectively shielded, with the most severe high-velocity streaks eliminated.
Residual Analysis: While the primary structural problem has been resolved, the PWC map indicates that the area is not yet “completely” mitigated. Small pockets of increased velocity remain.
The Path to Total Optimization: To achieve a perfect comfort rating, we must perform a final deep dive into the wind direction and amplification fields. This diagnostic step is essential to understand if these residual effects are caused by minor turbulence at the building edges or by a secondary downwash that requires a complementary strategy, such as a canopy or targeted vegetation.
By isolating the South-East (SE) wind direction in the updated simulation, we can identify the specific cause of the remaining discomfort zone.
- Particle Trace Observation: A close examination of the particle animation reveals a distinct flow pattern in the study area (right image). Particles are seen coming directly from the building’s vertical facade. This is a definitive signature of a Downwash effect.
To confirm the intensity of this phenomenon, we will now switch to the Amplification Field. This will allow us to quantify exactly how much the vertical surface is enhancing the wind speed relative to the ambient flow, providing the data needed to design a final horizontal mitigation element, such as a canopy or podium.
The updated amplification map confirms that the structural intervention successfully neutralized the Venturi effect; the area between the buildings no longer shows a white and yellow colour previously caused by the site’s topography.
The Roof Effect: Current visualizations show that the wind is now sliding over the rooftops of the adjacent buildings.
Impact and Origin: This redirected flow impacts directly against our building’s facade. This explains the particles seen “originating” from the wall—they are the visual result of the air mass being forced downward after the impact (Downwash effect).
The Podium Constraint: While a podium or a more aerodynamic building shape is the standard solution for Downwash, its effectiveness depends entirely on its extension. If the podium is too narrow, the descending wind simply “jumps” over the edge and returns to the street level.
Spatial Limitations: In this specific project, the limited space between structures makes a sufficiently large podium unfeasible, as it would obstruct the required free area.
To prove why a small structural addition isn’t enough, let’s look at the simulation results showing how a limited-width podium fails to intercept the flow.
Analysis of Results: As shown in the maps, the only improvement is a small “blue zone” located directly underneath the wall.
The “Jump” Phenomenon: The descending wind is only partially decelerated; the bulk of the air mass maintains its downward momentum, effectively jumping over the podium and striking the ground further into the street.
Proposed Alternatives: To achieve full mitigation while respecting spatial constraints, two strategies are suggested:
Vegetation (Trees/Hedges): Utilizing trees as a porous medium to break up the wind’s energy through friction rather than deflection.
Full-Length Canopy: Extending a horizontal canopy to cover the entire pedestrian area, ensuring that the descending flow is redirected far enough away from the walkways.
Conclusion: beyond simulation toward creative design
The analysis conducted throughout this study demonstrates that CFD tools should not be viewed merely as a technical validation process, but rather as an integral and dynamic component of the architectural design phase.
This analytical journey serves as just one example of the potential offered by Archiwind. My invitation to you is to approach every challenge with a critical spirit and curiosity. Do not limit yourselves to the first solution; instead, use the real-time feedback of the simulation to explore innovative shapes and configurations. Be creative and experiment with different designs to find the perfect balance between aesthetics, functionality, and bioclimatic comfort, ultimately making every project a better and more livable place for people.