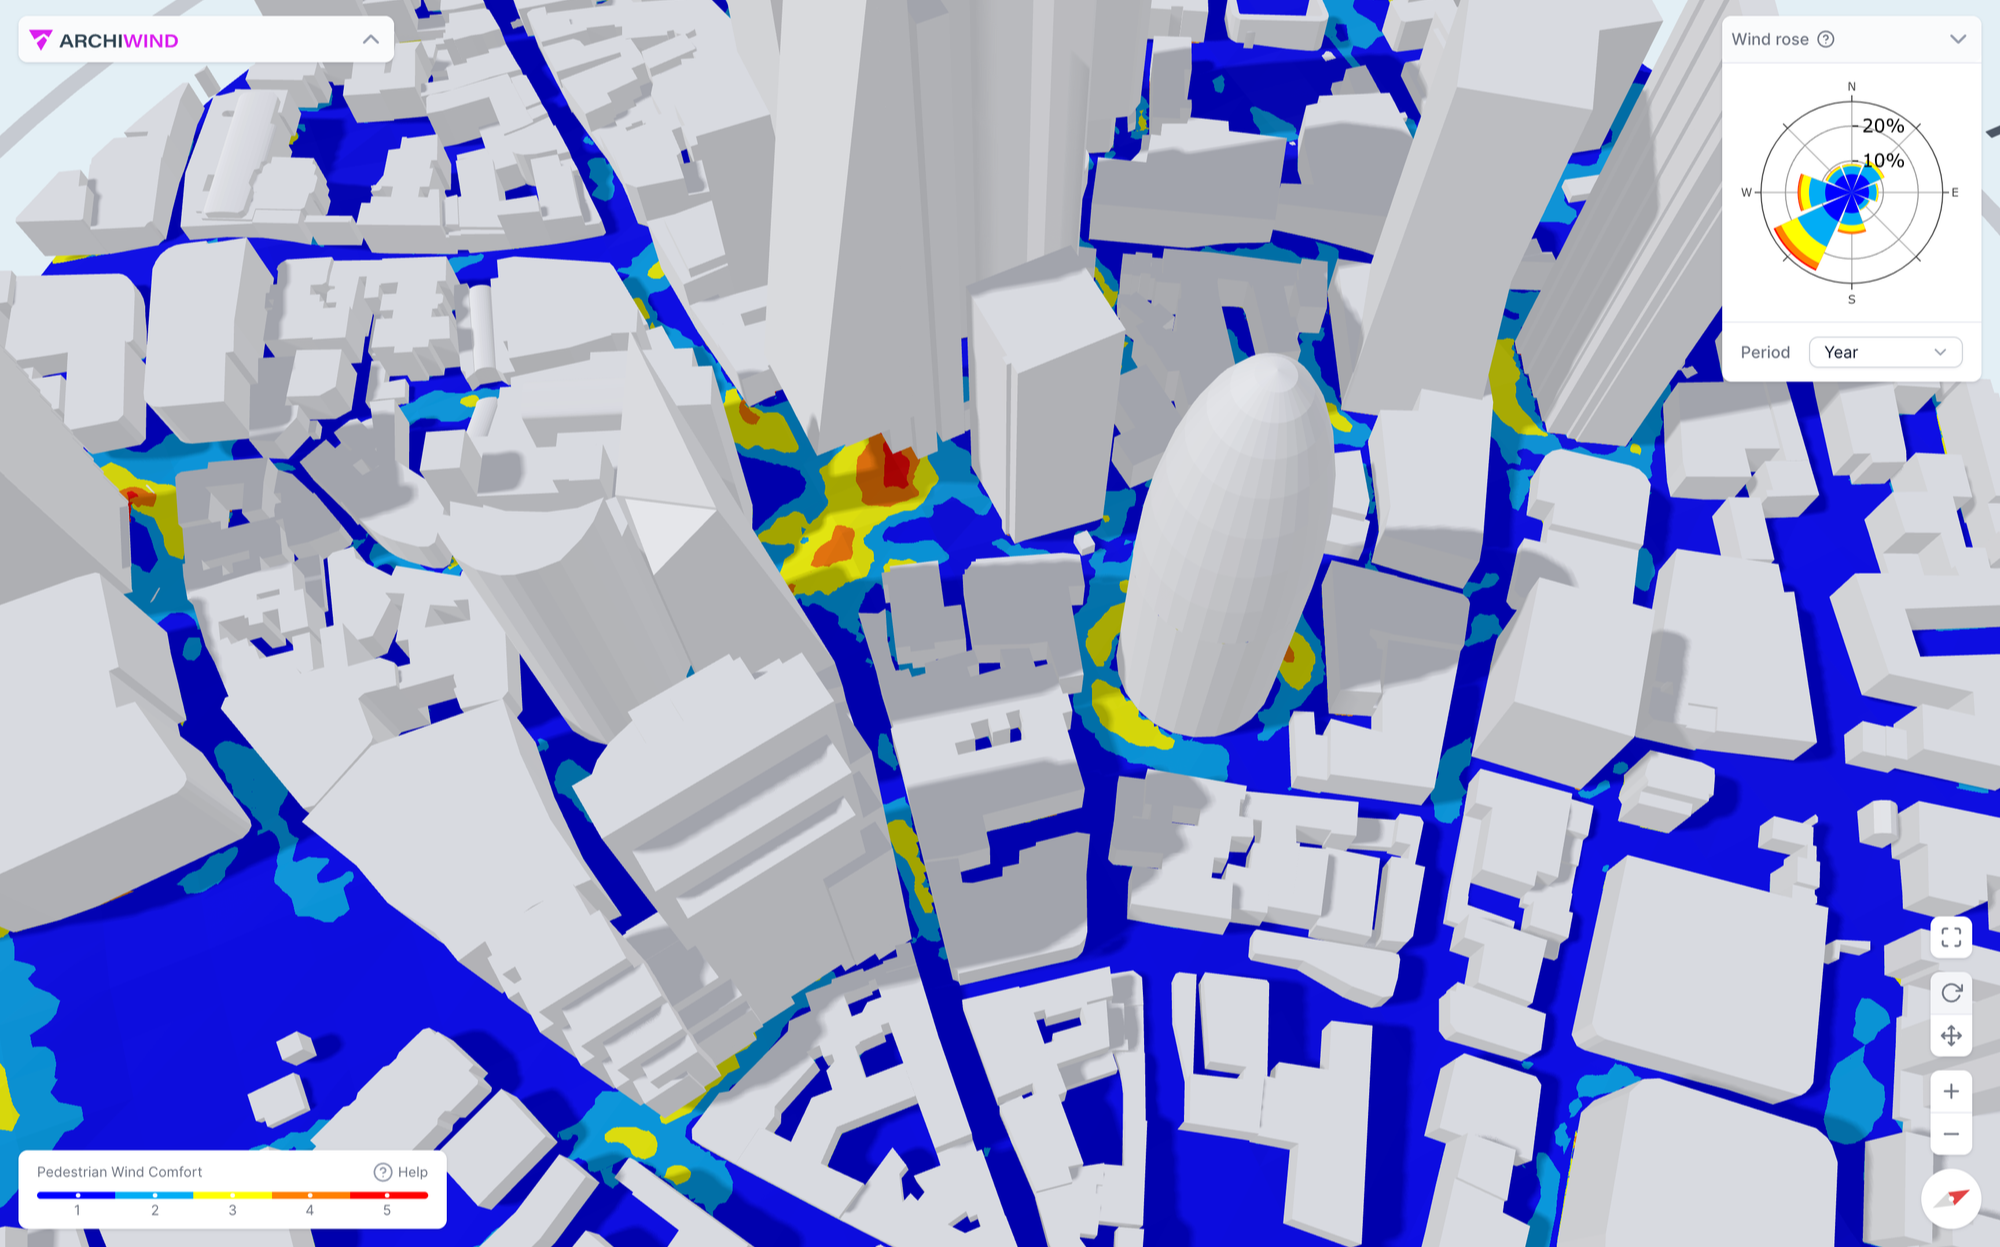
Pedestrian Wind Comfort and Safety
Pedestrian wind comfort describes whether an outdoor space is suitable for sitting, standing or walking. Wind safety checks whether strong winds could put people at risk.
ArchiWind uses Lawson 2001 by default, with results assessed 1.5 m above the local ground or occupied rooftop surface.
Understanding the Classes: Lawson 2001 Example
The tables below show how to read comfort and safety classes using Lawson 2001, ArchiWind’s default and the newest Lawson version offered in ArchiWind. Other schemes use different limits and activity labels; see the criteria pages below for the scheme you want to use.
Both comfort and safety results refer to the selected assessment period: annual, summer or winter. The percentages in each table give how often the wind exceeds the threshold wind speed during that period.
Pedestrian Wind Comfort
People need calmer conditions for sitting than for walking. The comfort class shows which activity the wind conditions are suitable for during at least 95% of the selected assessment period.
For example, Sitting means the wind stays at or below 4 m/s for 95% of the time or more. If a place is too windy for sitting but stays at or below 6 m/s for at least 95% of the time, it is classified as Standing. Uncomfortable means the wind is above 10 m/s for more than 5% of the time. This is a comfort class; safety has its own limits, shown below.
| Category | Threshold wind speed | Exceedance probability | Activity | Color |
|---|---|---|---|---|
| A | 4 m/s | ≤ 5% | Sitting | |
| B | 6 m/s | ≤ 5% | Standing | |
| C | 8 m/s | ≤ 5% | Strolling | |
| D | 10 m/s | ≤ 5% | Business Walking | |
| E | 10 m/s | > 5% | Uncomfortable |
Exceedance probability is the percentage of time the wind speed exceeds the threshold wind speed, after combining all wind directions. Read the table from the top: each location takes the first category whose condition it meets. Comfort is classified on the mean wind speed; the gust-equivalent mean (GEM) is used for safety only.
See the Lawson 2001 page for the detailed method and sources.
Pedestrian Wind Safety
Wind safety describes the risk from strong winds during the selected period. Lawson 2001 checks mean wind speed and gust-equivalent mean (GEM) against 15 m/s and 20 m/s, assessing each separately and using the worse safety class. GEM converts short gusts into an equivalent average wind speed so they can be assessed using the same limits.
| Category | Threshold wind speed (mean / GEM) | Exceedance probability | Meaning | Color |
|---|---|---|---|---|
| A | 15 m/s | ≤ 0.023% | Safe | |
| B | 20 m/s | ≤ 0.023% | Unsafe | |
| C | 20 m/s | > 0.023% | Dangerous |
Exceedance probability is the percentage of time the wind speed exceeds the threshold wind speed, after combining all wind directions. Read the table from the top: each location takes the first class whose condition it meets. Unsafe means winds exceed 15 m/s too often to be Safe, while the time above 20 m/s remains within the limit. Dangerous means winds exceed 20 m/s more often than the limit allows.
Safety limits refer to annual results: for an annual result, 0.023% is approximately two hours per year. Seasonal safety maps apply the same limit to that season. See the Lawson 2001 page for details.
How the Assessment Works
To produce Pedestrian Wind Comfort and Pedestrian Wind Safety maps, ArchiWind combines three inputs:
- Wind simulations — how buildings and open spaces affect wind from different directions.
- Regional wind climate statistics — how often winds of different speeds and directions occur at the location.
- Comfort and safety criteria — the limits used to classify those conditions.
Together, these inputs turn simulated wind conditions into comfort and safety maps that you can compare with the intended use of the space.
1. Wind Simulations
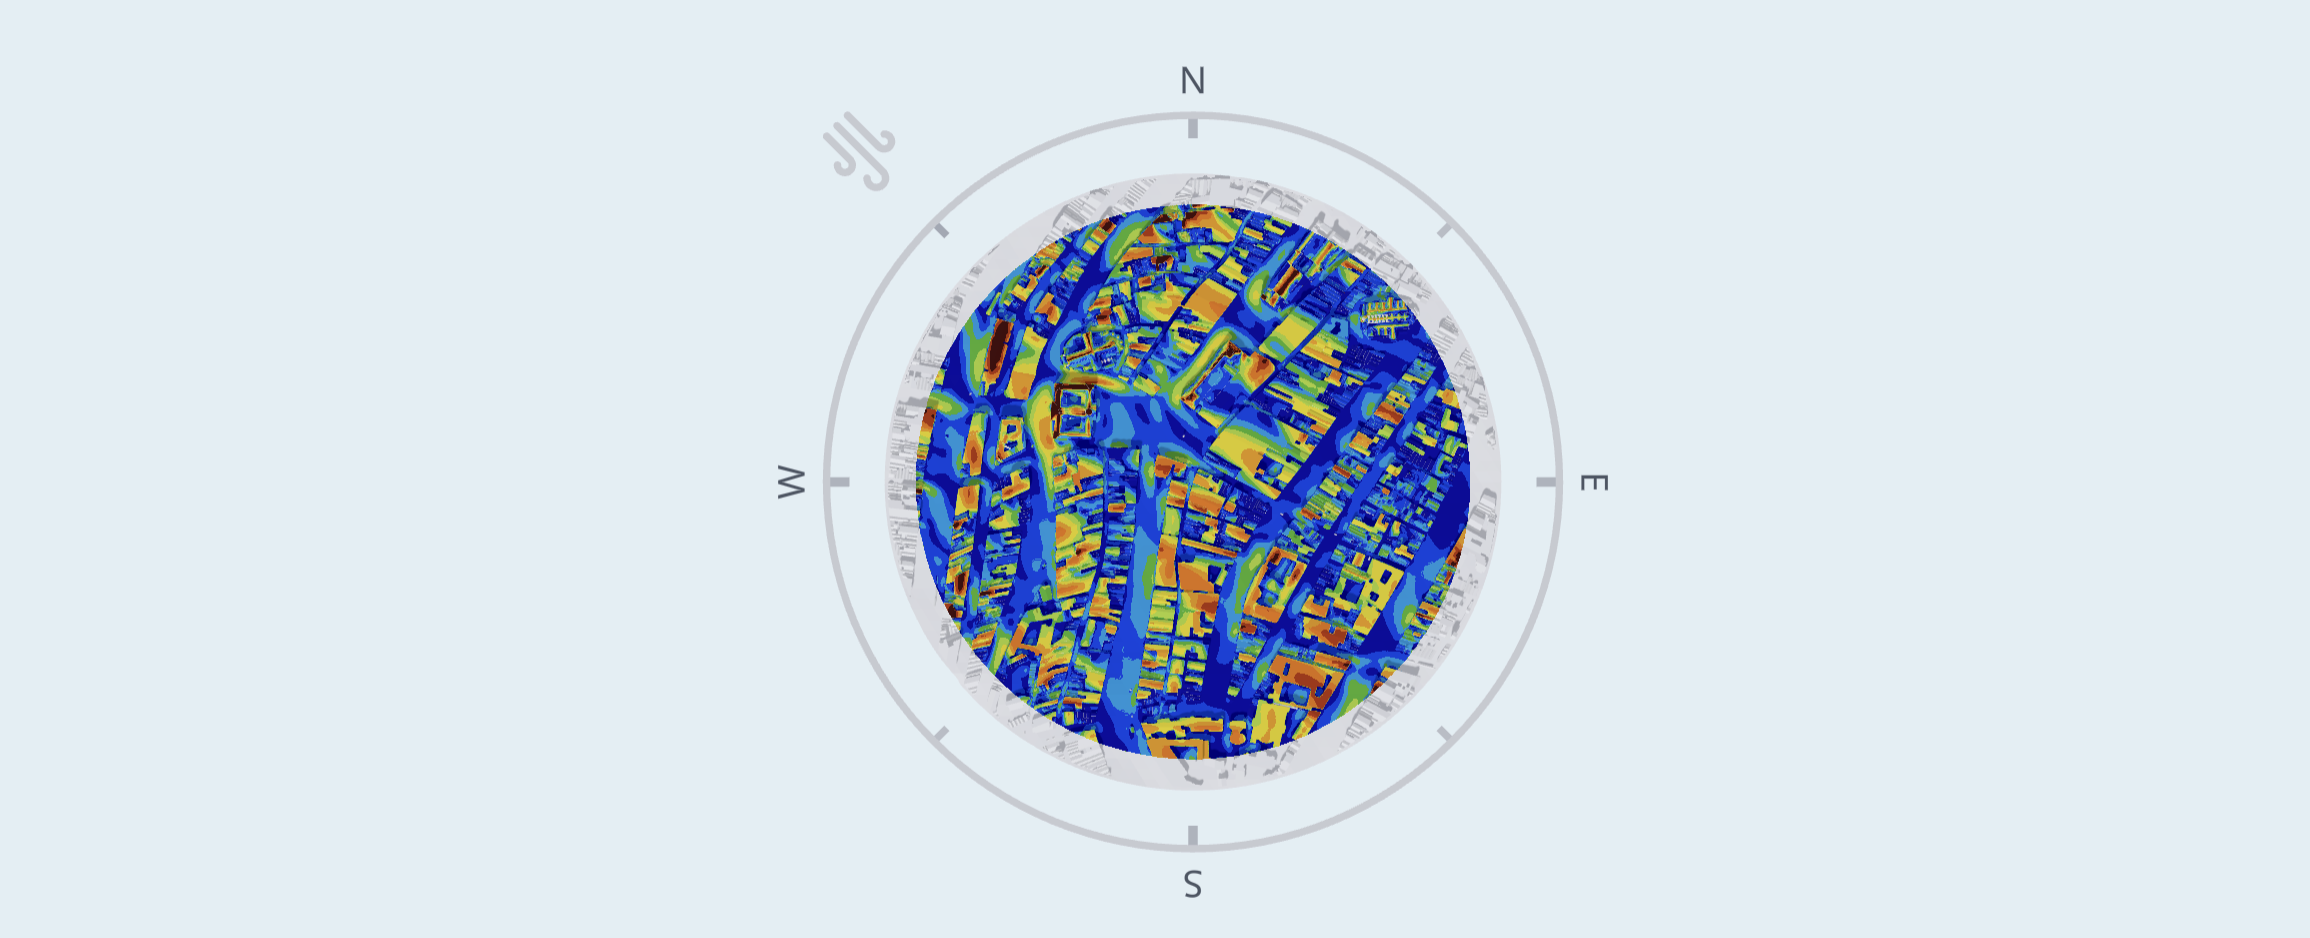
Multiple CFD simulations model wind flow around buildings and open spaces from different wind directions. Simulations use 8, 12, or 16 wind directions, depending on the applicable standard.
2. Regional Wind Climate Statistics
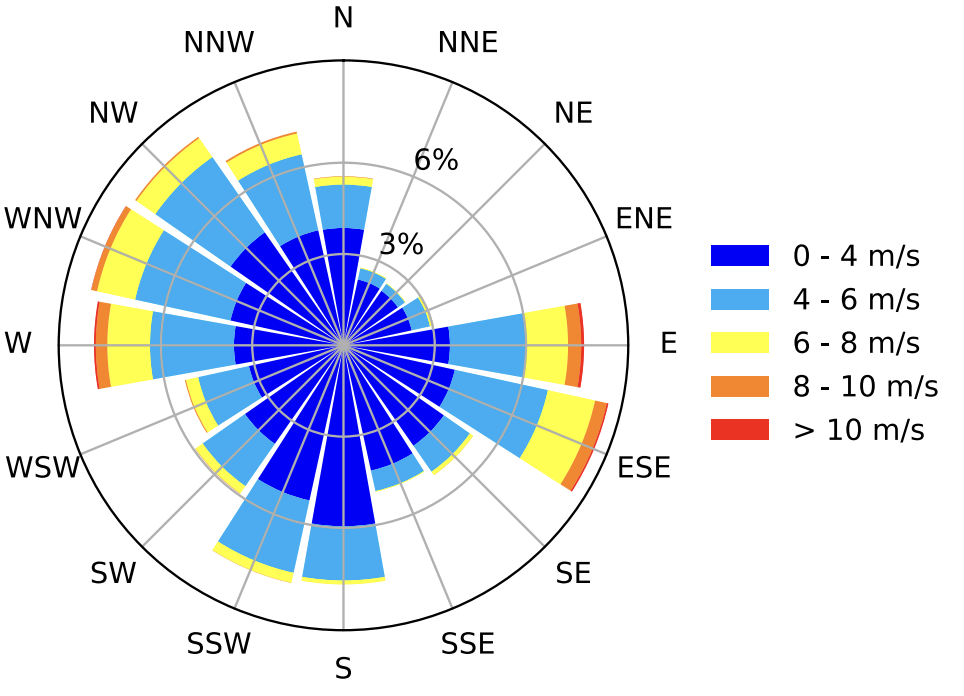
The wind climate describes how frequently winds arrive from each direction and how their speeds vary. ArchiWind combines these statistics with the directional CFD results to estimate local wind conditions over time.
Under Wind data source, choose ArchiWind (the default) or upload your own climate data.
ArchiWind retrieves historical wind speed and direction data for your location: MeteoBlue for paying users and Open-Meteo for trial users. This option is only available for geolocated projects; if the project has no coordinates, you must upload your own climate data.
Custom climate uploads, for example from a local measurement mast, support:
- EPW file
- IL GovMap CSV file
- UrbaWind TAB file
- TIM file
All uploaded files are validated against ArchiWind’s data requirements before use.
Choose data representative of the site and appropriate for the selected criteria. The source’s reference height is distinct from the 1.5 m pedestrian assessment height; see wind-data reference heights and roughness corrections.
3. Comfort and Safety Criteria
Choose the criteria required for your project. Each scheme defines suitable wind conditions for different activities and the limits used to assess safety.
Set the scheme at project level: select + New project, then choose Wind Comfort and Safety Criteria on the project creation page. Lawson 2001 is the default.
Selecting a scheme chooses both the comfort and safety classifications. Lawson 1978 has no separate safety classification in the criteria documented here, so ArchiWind pairs it with Lawson 2001 safety, the newest Lawson version offered.
Explore each scheme below for its classes, calculations and sources.
Reading the Resulting Maps
ArchiWind combines the simulations with the regional wind statistics and applies the selected criteria. The results are shown as separate Pedestrian Wind Comfort and Pedestrian Wind Safety maps at 1.5 m above the local surface. Read each map with its own legend and compare both comfort and safety results with the intended use of the space. For example, a walking comfort class may suit a footpath but not outdoor seating; the safety map shows whether the space also meets the selected safety limits.